

Marker Horizons
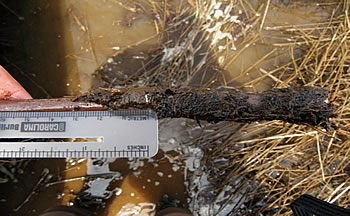
Marker horizons measure vertical sediment accretion. A thick marker layer is placed on top of the sediment surface. Sediment cores are later taken and the amount of sediment accumulated on top of the marker is measured. Markers can be comprised of many different types of materials including sand, brick dust, glitter and feldspar. We typically use white feldspar clay because it is easily distinguishable from sediments.
Marker horizons can be paired with Surface Elevation Tables (SET) to explain processes behind elevation increases or decreases (i.e. sedimentation, shallow subsidence, etc.).
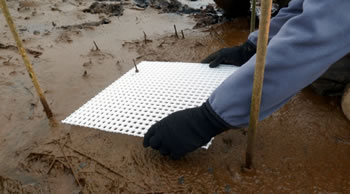
In macrotidal environments, such as the Puget Sound, marker horizons can be quickly washed away during daily high tides. This is especially true in lower elevation, unvegetated areas such as tide flats. For these habitats, we have used squares of plastic grids, cut from fluorescent light covers. The grids are pressed down into the sediment until they are level with the ground surface. This method was developed by WWU professor, John Rybczyk, who has installed and maintained marker horizons and SETs throughout Washington State.
Benefits: easy, inexpensive, mm resolution
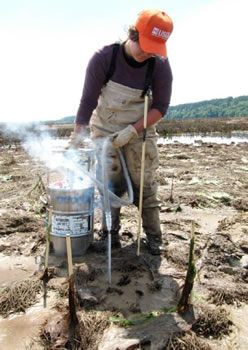
Limitations: repeated measures can deplete marker horizon layer, can be affected by invertebrate bioturbation, does not measure erosion, can be eroded/washed away (typically in unvegetated areas, in this case, use of plastic grid or sediment plate is recommended), can be difficult to measure in areas of standing water (may need to freeze sediment core using liquid nitrogen).
Installation and Measurement Methods: Currently, the most comprehensive source for marker horizon, installation and measurements can be found at the USGS Patuxent Wildlife Research Center website (http://www.pwrc.usgs.gov/set/installation/markers.html)
Data Entry and Analysis: For examples on how to enter and analyze marker horizon data, see (http://www.pwrc.usgs.gov/set/readMarkers.html and http://www.nisquallydeltarestoration.org/science_geomorphology_sedimentation.php).
SET Pacific Northwest Contacts: Glenn Guntenspergen, USGS PWRC Research Ecologist, has installed marker horizons in conjunction with SETs in the Pacific Northwest, nationally, and globally (http://www.pwrc.usgs.gov/staff/profiles/documents/guntenspergen.htm).
John Rybczyk, Associate Professor at Western Washington University, has installed numerous marker horizons in conjunction with SETs throughout Washington State (http://web.mac.com/johnrybczyk/iWeb/Site/Home%20Page.html).
Isa Woo, USGS WERC Biologist, is a co-principal investigator for the Nisqually NWR restoration monitoring program and has helped to install, measure, and analyze marker horizon data from that project (http://www.werc.usgs.gov/person.aspx?personID=150).